Investment Track Record - Performance of APIL
Under the management of APS, APIL has achieved a solid track record of returns for its shareholders. Following is a list of selected realized investments:
 |
Property: Universal Trade Centre Purchase Date: 2005 May 31 Purchase Price: HK$3,500 / sq ft Return on Purchase Price (Gross): 76.6% |
|---|---|
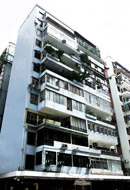 |
Property: Welcome Mansion Purchase Date: 2005 September 25 Purchase Price: HK$3,428 / sq ft Return on Purchase Price (Gross): 76.9% |
 |
Property: Hoi Kung Court Purchase Date: 2005 September 12 Purchase Price: HK$3,733 / sq ft Return on Purchase Price (Gross): 63.7% |
 |
Property: Pearl Oriental House Purchase Date: 2006 March 31 Purchase Price: HK$4,000 / sq ft Return on Purchase Price (Gross): 67.5% |
 |
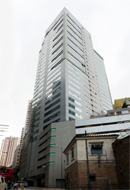
Property: CentreStage Purchase Date: 2006 December 30 Purchase Price: HK$6,815 / sq ft Return on Purchase Price (Gross): 43.2% |
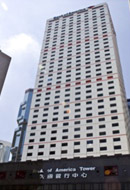 |
Property: Bank of America Tower Purchase Date: 2006 December 30 Purchase Price: HK$8,738 / sq ft Return on Purchase Price (Gross): 83.1% |
 |
Property: 83 Wanchai Road Purchase Date: 2005 August 31 Purchase Price: HK$2,420 / sq ft Return on Purchase Price (Gross): 123.2% |
 |
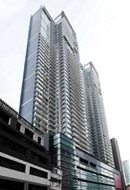
Property: The Merton Purchase Date: 2006 December 30 Purchase Price: HK$6,241 / sq ft Return on Purchase Price (Gross): 65.5% |
Since its inception, APIL’s NAV per share has grown from HK$0.97 at June 2005 to HK $4.06 as at end of June 2020 (June 2020 figures based on unaudited management accounts and independent third-party property valuations)

Net Assets (Or Shareholders Funds) of APIL have grown from HK$ 30.3 Million at June 2005 to HK$ 255.6 Million as at end of June 2020
| APIL (in HK$m) | Jun-05 | Jun-06 | Jun-07 | Jun-08 | Jun-09 | Jun-10 | Jun-11 | Jun-12 | Jun-13 | Jun-14 | Jun-15 | Jun-16 | Jun-17 | Jun-18 | Jun-19 | Jun-20 |
|---|---|---|---|---|---|---|---|---|---|---|---|---|---|---|---|---|
| Total Assets | 37.1 | 67.2 | 100.7 | 204.4 | 161.3 | 170.8 | 416.1 | 442.6 | 492.3 | 543.3 | 625.8 | 551.3 | 528.9 | 613.2 | 614.5 | 353.7 |
| Total Liabilities | 6.8 | 24.8 | 39.8 | 74.7 | 57.9 | 34.3 | 153.1 | 161.1 | 171.8 | 176.8 | 190.1 | 148.1 | 217.9 | 228.5 | 234.7 | 98.1 |
| Non Controlling Interest | 0 | 0 | 0 | 0 | 0 | 0 | 39 | 43.2 | 43.6 | 55.7 | 68.8 | 62.1 | 66.9 | 77.8 | 78.3 | 0 |
| Net Assets | 30.3 | 42.4 | 60.9 | 129.7 | 103.4 | 136.5 | 224.0 | 238.3 | 276.9 | 310.8 | 366.9 | 341.1 | 244.1 | 306.9 | 301.5 | 255.6 |

Loan to Value Ratio (LTV) of the property portfolio remained below 50% for the financial years of 2005 to June 2020. The LTV as at end of June 2020 34.61%.
| APIL (in HK$m) | Jun-05 | Jun-06 | Jun-07 | Jun-08 | Jun-09 | Jun-10 | Jun-11 | Jun-12 | Jun-13 | Jun-14 | Jun-15 | Jun-16 | Jun-17 | Jun-18 | Jun-19 | Jun-20 |
|---|---|---|---|---|---|---|---|---|---|---|---|---|---|---|---|---|
| Property Assets (LS) | 12.8 | 57.9 | 98.4 | 199.8 | 143.3 | 150.9 | 371.3 | 401.3 | 448.5 | 504.3 | 593.3 | 504 | 450.3 | 613.2 | 614.5 | 257.6 |
| Bank Loans | 6.1 | 23.8 | 33.5 | 58.4 | 48.2 | 20.2 | 129.4 | 137.2 | 142.4 | 144 | 146.7 | 117.6 | 189.6 | 191 | 234.7 | 89.2 |
| Loan to Value (RS) | 47.80% | 41.10% | 34.00% | 29.30% | 33.60% | 13.40% | 34.80% | 34.20% | 31.70% | 28.50% | 24.70% | 23.30% | 42.10% | 36.30% | 35.43% | 34.61% |
Following is a snapshot of APIL consolidated property portfolio sector, for the financial years ended 30 June 2019 and June 2020 (Unaudited Accounts)
| APIL | Jun-19 | Jun-20 | ||||
|---|---|---|---|---|---|---|
| Properties | Number | Value(HK$m) | % by Value | Number | Value(HK$m) | % by Value |
| Commercial | 17 | 113.30 | 45.36% | 17 | 116.85 | 45.36% |
| Industrial | 0 | 0 | 0.00% | 0 | 0 | 0.00% |
| Residential | 15 | 143.62 | 54.64% | 15 | 140.73 | 54.64% |
| Total | 32 | 256.92 | 100% | 32 | 257.58 | 100% |


Following is a table showing properties sold by APIL in financial year ended 30 June 2020.
| Properties / Use (R/C) | Location | Purchase Date (y/m/d) | Selling Date (y/m/d) | Purchase Price (HK$) | Selling Price (HK$) | Gross Return (%) |
Gross Return on Equity Applied (%) |
|---|---|---|---|---|---|---|---|
| 88C Pok Fu Lam | Western | 4-Nov-10 | 30-Nov-19 | 80 Million | 270 Million | 237.5% | 514.60% |
| Total | 80 Million | 270 Million | 237.5% | 514.60% |